Sweep: scale¶
Varies: scale factor f — terrain ×f, nodes ×f² (50 → 200 nodes).
← Benchmark index · Metrics · Methodology
Provenance — measured at
v1.3.0. Every number on this page was produced by the campaign runs named below, all of which predate thev1.3.0tag (19009be). No commit betweenv1.2.0and that tag changes routing behaviour, so checking outv1.3.0reproduces these cells. The default branch will not: it has since changed the pheromone weighting (#327,betaAnts/betaData2.0 → 20) and the per-seed RNG stream assignment (#352), either of which moves measured values. See Provenance and #365.
What it varies¶
Reproduces Fig. 3 of the AntHocNet paper (Di Caro/Ducatelle/Gambardella, PPSN VIII 2004, §4): terrain is scaled by f and node count by f², holding node density roughly constant while the network grows. Unlike the paper (AODV only), every baseline is run on identical realisations.
Defined as SWEEPS["scale"] in
ns3/tools/run-scenarios.py — the points
are f = 1.0 (50 nodes, 1500×500 m), 1.4 (98, 2100×700), 1.8 (162, 2700×900) and
2.0 (200, 3000×1000).
How it is produced¶
Sweeps are too heavy for the per-merge benchmarks workflow, which runs
only the discrete scenarios. They come from the manual Scenario matrix +
charts workflow (scenario-matrix.yml), which renders sweep-scale.png into
docs/benchmarks/ and uploads the classified CSV; the table below is
filled in by pointing update-benchmarks.py at that CSV.
Raw sweep data rescued from expired artifacts lives in
../campaign/ and is summarizable with the benchmark-results
skill's sweep_summary.py. This sweep is the one that had to be seed-split
to run at all — see the provenance note below.
Results¶
Post-#88/#169, 20 seeds, 95% CIs. These numbers include the
T_hop= 3 ms fix (#88, PR167) and the reactive-hop-cap removal¶
(#169, PR #170), and meet the methodology runs floor. AntHocNet leads delivery at every point (+11.0 to +17.8 pp, intervals disjoint except at f = 2.0) while carrying 16–29 % lower normalized routing load. The
delay99column is worse throughout — the confirmed #21 tail, whose remediation is tracked in #308 against a like-for-likep99Commontarget. Do not quotepath_div_*/entropyfrom these cells (#230).
Provenance — and why this sweep needed seed-splitting¶
Dispatched 2026-08-03/04 on main, scenario-matrix.yml, 3.42-opt image,
900 s, range/disk PHY, 20 seeds per point. The f = 1.0 point ran as a single
20-seed job; the other three exceed the 340-minute step ceiling at 20 seeds
and were run as multiple dispatches over disjoint seed ranges using the
runFirst input (#126,
PR #322), then recombined with
pool_runs.py, which
recomputes each mean and standard deviation from the pooled per-run rows
(#319) rather than
combining split aggregates. Seed coverage was verified as exactly 1–20 per
protocol per point, with no gaps and no duplicates.
| point | nodes | dispatches | run IDs |
|---|---|---|---|
| f = 1.0 | 50 | 1 × 20 seeds | 30854990473 |
| f = 1.4 | 98 | 2 × 10 seeds | 30876649282, 30876656386 |
| f = 1.8 | 162 | 6 × 3 + 1 × 2 seeds | 30898626094, 30898635717, 30898646523, 30898656990, 30898670257, 30898680790, 30898694649 |
| f = 2.0 | 200 | 18 × 1 + 1 × 2 seeds | 30898711742, 30898724984, 30898736284, 30898751349, 30898769563, 30898781607, 30898794804, 30898809114, 30898820499, 30898833922, 30898846247, 30898858035, 30898870503, 30898882109, 30898892224, 30898902277, 30898913177, 30898925485, 30876743751 |
The pooled inputs are committed as
../campaign/pooled-scale-{1.4,1.8,2.0}-20260804.csv (plus their per-run
siblings); f = 1.0 predates #319 and has no sibling, so it is published from
its aggregate CSV unchanged.
Measured simulation cost per seed, by field size (900 s sim, -opt image,
queue-delayed jobs excluded so these are compute time, not wall-clock):
| point | nodes | min/seed | growth exponent vs previous point |
|---|---|---|---|
| f = 1.0 | 50 | 5.0 | — |
| f = 1.4 | 98 | 20.7 | 2.12 |
| f = 1.8 | 162 | 98.2 | 3.09 |
| f = 2.0 | 200 | 186.4 | 3.04 |
Cost grows faster than quadratically in node count, and the exponent itself rises with field size — which is why the first seed-split attempt (sized by extrapolating the 50 → 98-node curve) still lost its f = 1.8 and f = 2.0 chunks to the ceiling, and why the successful sizing came from measuring per-seed cost at each field size. The whole sweep is ≈ 116 CPU-hours. Anyone re-running it should size chunks from the table above rather than from a two-point extrapolation.
Sweep scale — mean of 20 run(s) per point, every baseline on identical realisations; ± is the 95% CI half-width (#293). Generated by run-scenarios.py; chart by make-charts.py.
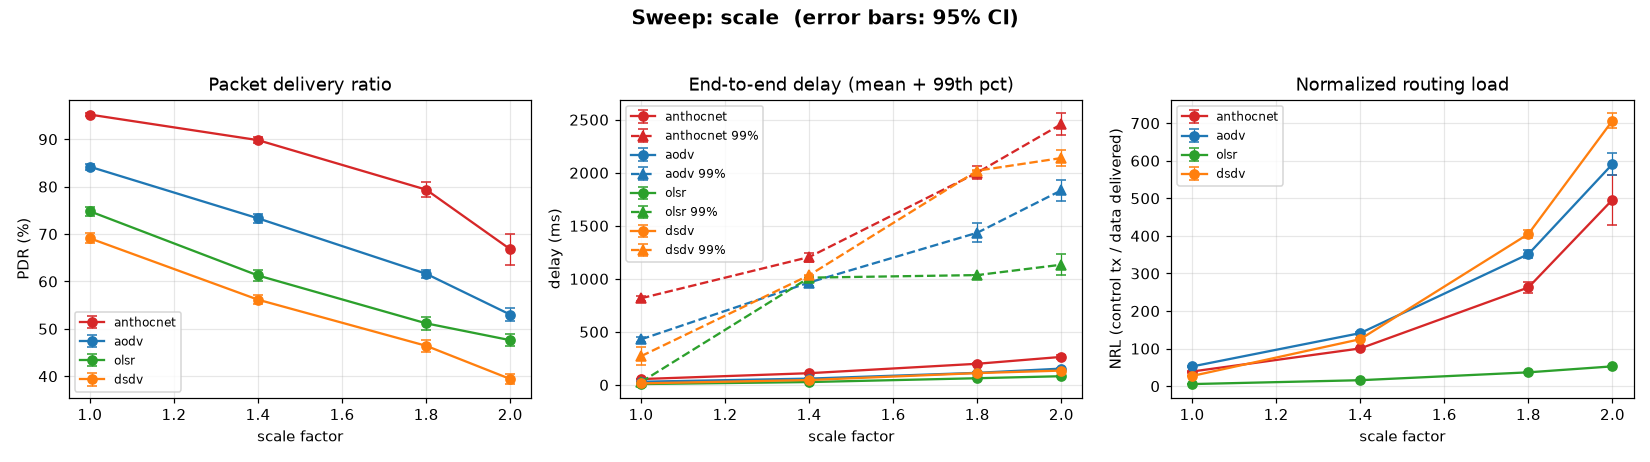
| scale factor | protocol | PDR % ±95 | mean delay (ms) ±95 | 99th delay (ms) ±95 | throughput (kbps) | NRL ±95 | jitter (ms) | dOff90 (ms) |
|---|---|---|---|---|---|---|---|---|
| 1.0 | anthocnet | 95.2 ± 0.3 | 54.9 ± 2.3 | 816.6 ± 25.7 | 6.25 | 38.963 ± 0.46 | 88.32 | 283.6 |
| 1.0 | aodv | 84.2 ± 0.6 | 29.8 ± 1.5 | 429.1 ± 25.5 | 5.55 | 52.419 ± 0.89 | 43.91 | inf |
| 1.0 | dsdv | 69.1 ± 1.1 | 14.3 ± 0.8 | 270.6 ± 82.1 | 4.59 | 27.127 ± 0.49 | 22.65 | inf |
| 1.0 | olsr | 74.8 ± 0.9 | 7.9 ± 0.4 | 26.5 ± 0.9 | 4.82 | 5.572 ± 0.09 | 10.68 | inf |
| 1.4 | anthocnet | 89.8100 ± 0.6 | 110.3200 ± 4.8 | 1205.3000 ± 42.5 | 5.9485 | 100.4570 ± 2.40 | 164.9015 | inf |
| 1.4 | aodv | 73.3150 ± 1.0 | 59.2650 ± 3.2 | 965.3000 ± 37.6 | 4.8160 | 141.1965 ± 3.47 | 84.7745 | inf |
| 1.4 | dsdv | 56.1500 ± 0.9 | 45.9450 ± 2.8 | 1033.7500 ± 3.9 | 3.7230 | 125.0810 ± 2.19 | 79.5920 | inf |
| 1.4 | olsr | 61.2550 ± 1.2 | 26.8300 ± 1.9 | 1011.2000 ± 1.3 | 4.0215 | 15.8410 ± 0.32 | 42.3560 | inf |
| 1.8 | anthocnet | 79.3600 ± 1.5 | 199.2450 ± 10.6 | 2001.2000 ± 58.3 | 5.2315 | 262.8115 ± 15.74 | 275.6305 | inf |
| 1.8 | aodv | 61.6100 ± 0.8 | 113.6750 ± 5.4 | 1434.7500 ± 89.1 | 4.0890 | 351.4885 ± 10.59 | 158.7285 | inf |
| 1.8 | dsdv | 46.4200 ± 1.3 | 111.3800 ± 3.2 | 2019.4500 ± 3.3 | 3.0610 | 405.1405 ± 10.59 | 188.1960 | inf |
| 1.8 | olsr | 51.1600 ± 1.3 | 62.9050 ± 4.7 | 1035.3500 ± 3.3 | 3.3620 | 36.8080 ± 0.96 | 102.3335 | inf |
| 2.0 | anthocnet | 66.7850 ± 3.2 | 263.9800 ± 18.9 | 2458.6500 ± 102.2 | 4.4380 | 496.3050 ± 66.88 | 346.9210 | inf |
| 2.0 | aodv | 53.0000 ± 1.3 | 153.5750 ± 9.4 | 1834.5500 ± 100.3 | 3.5090 | 591.2330 ± 29.58 | 205.7745 | inf |
| 2.0 | dsdv | 39.4200 ± 1.1 | 134.8800 ± 6.6 | 2138.9000 ± 74.2 | 2.6145 | 706.8070 ± 19.55 | 222.6235 | inf |
| 2.0 | olsr | 47.6050 ± 1.3 | 81.9950 ± 3.9 | 1133.2500 ± 99.5 | 3.1260 | 52.7170 ± 1.53 | 134.3915 | inf |