Satellite suite: the moving constellation (leo-walker)
Regime: a time-varying LEO Walker shell — satellites move, ground stations hand over, ISLs fail and recover. The static ISL torus that came first is isl-grid.md; why satellites need their own suite at all is network-regimes.md. The substrate decision is ADR-0022.
← Benchmark index · Metrics · Methodology
Provenance — measured at
0b5a65ad. Seventeensatellite-benchmark.ymldispatches withharness=leo-walker, one arm per dispatch, onghcr.io/danieljoppi/ns3:3.48(default profile), 20 seeds each. Every cell carries its run id on its first line and its full##CONFIG##line, and every cell passesscenario_check.py(the #297 handover-clock and outage-accounting rules) as committed.
cell anthocnet aodv olsr geo-greedy oracle oracle-delay walker1637827387100 37827390737 37827395914 37827410383 37827401516 37827405771 starlink137827426356 37827430778 37827443695 37827433965 37827439616 starlink1-storm37827449496 37827453949 37827467035 37827458721 37827462965 hypatiacalibration37827470132 Cells:
docs/benchmarks/cells/leo-<cell>-<arm>.txt. Every leo-walker number measured before0b5a65adis superseded — see the pairing bug.
The cells
All cells: 4 ground-to-ground CBR flows (2 kbit/s each) between six cities (New York, London, São Paulo, Johannesburg, Tokyo, Sydney), 300 s, minimum elevation 25°, link delays re-read from ECEF distance every 0.1 s, ISL failure overlay at 1 % (mean outage 2 s), 10 Mbps links. The handover clock fires at second 12 of every 15 s — the Starlink reconfiguration interval measured by Tanveer et al. (WWW 2024), and the phase the LENS trace below confirms.
| cell | shell | what it adds |
|---|---|---|
walker16 |
16 planes × 16 sats, 1150 km, 53°, phasing 1 | a small Walker-delta shell: 256 satellites, long hops |
starlink1 |
72 × 22, 550 km, 53°, phasing 39 — Starlink shell 1 | the real shell size: 1584 satellites, ~25-hop paths |
starlink1-storm |
as starlink1 |
a 10 % mass satellite failure at t = 150 s |
Arms:
- anthocnet — this repository, defaults.
- aodv — stock ns-3 AODV, the reactive baseline every other suite uses.
- olsr — stock ns-3 OLSR, the proactive link-state baseline. walker16 only (see below).
- geo-greedy — an idealised greedy geographic comparator: each hop goes to the neighbour nearest the destination's serving satellite, with perfect global position knowledge and no control traffic. It stands for the position-based family the satellite literature proposes, at its best case.
- oracle — the precomputed shortest-hop control (#196), re-solved every
1 s (the oracle module's default
RecomputeInterval). A delivery bound, not a delay bound: one hop count covers links of very different lengths. - oracle-delay — the same oracle with
Metric=delay: Dijkstra on current channel delays, re-solved every 0.1 s on walker16 (oracleInterval=0follows--delayUpdate) and every 1 s on S1 to keep CI time bounded. This is the latency bound, and the Hypatia-style control.
OLSR runs on walker16 only. On S1's 1584 nodes its topology flooding is the practical limit of the harness, not of the substrate (ADR-0022, criterion 5): even the 256-node walker16 cell took 5 h 54 min of CI for 20 seeds.
Headline
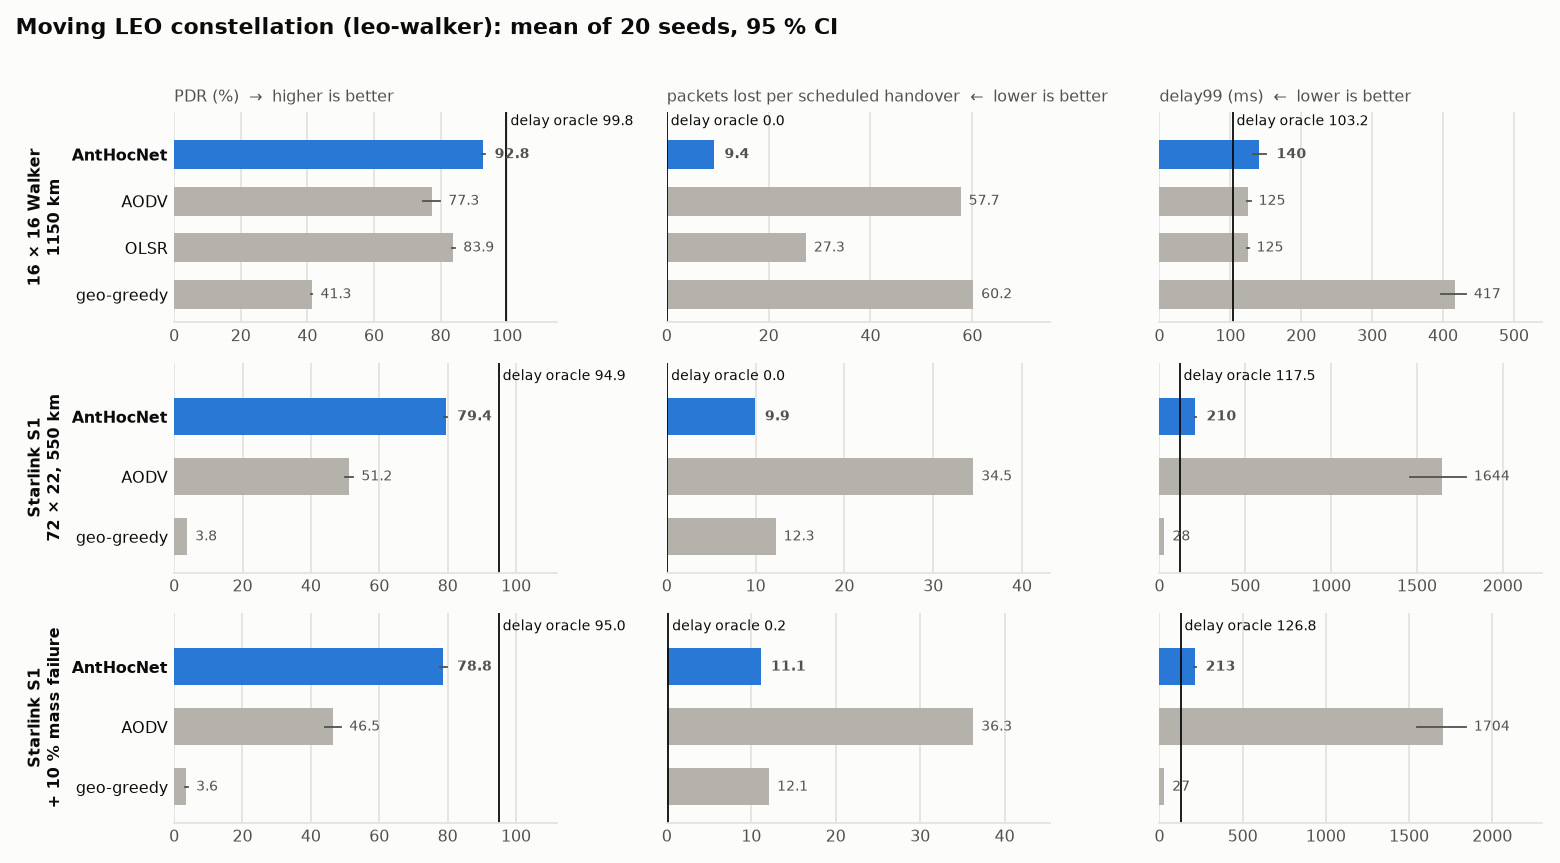
- AntHocNet beats AODV on every cell, by more as the shell grows: +15.5 pp PDR on walker16, +28.2 pp on Starlink S1, +32.3 pp under the S1 storm — all 20 of 20 seeds, Wilcoxon p = 1.9e-06 — with lower mean delay on every cell.
- The handover is where the difference lives. AntHocNet loses 9.4–11.2 packets per scheduled handover; AODV 34.5–57.7. The oracles, which re-solve on the new topology instantly, lose ~0.
- The gap to the bound grows with path length. AntHocNet is 7.0 pp under the delay oracle on walker16 (~9 hops) and 15.5 pp under it on S1 (~25 hops). That is the residual a 25-hop ant has to cover between two 15 s reconfigurations.
- Greedy geographic forwarding is not a viable comparator on a Walker grid, even idealised — see the geo-greedy verdict.
Tables below are the output of
python3 ns3/tools/leo-summary.py walker16 starlink1 starlink1-storm, pasted
unedited; rerun it on the committed cells to reproduce every number.
walker16
| arm | seeds | PDR % | mean delay (ms) | delay99 (ms, boot) | NRL | refused at source % |
|---|---|---|---|---|---|---|
| anthocnet | 20 | 92.84 ± 0.40 | 67.33 ± 1.18 | 140.5 [131.4, 150.9] | 97.63 ± 1.69 | 0.00 |
| aodv | 20 | 77.34 ± 2.58 | 71.97 ± 0.95 | 125.4 [123.0, 128.6] | 92.84 ± 3.24 | 0.00 |
| olsr | 20 | 83.88 ± 0.53 | 67.37 ± 0.47 | 124.7 [123.5, 125.8] | 306.59 ± 1.87 | 2.91 |
| geo-greedy | 20 | 41.35 ± 0.19 | 76.91 ± 2.07 | 417.3 [396.9, 432.2] | 0.00 ± 0.00 | 0.00 |
| oracle (bound) | 20 | 98.35 ± 0.12 | 69.85 ± 0.09 | 123.2 [123.0, 123.5] | 0.00 ± 0.00 | 0.00 |
| oracle-delay (bound) | 20 | 99.79 ± 0.03 | 61.56 ± 0.05 | 103.2 [103.0, 103.6] | 0.00 ± 0.00 | 0.00 |
AntHocNet − arm, paired per seed (95 % t-CI, Wilcoxon p):
| vs | n | Δ PDR (pp) | Δ mean delay (ms) |
|---|---|---|---|
| aodv | 20 | +15.50 [+12.91, +18.09], p=1.9e-06 | -4.64 [-6.20, -3.07], p=1.3e-05 |
| olsr | 20 | +8.96 [+8.36, +9.56], p=9.6e-05 | -0.04 [-1.34, +1.26], p=0.94 |
| geo-greedy | 20 | +51.50 [+51.06, +51.94], p=9.6e-05 | -9.57 [-12.09, -7.05], p=3.8e-06 |
Handover metric family (sums over seeds; outage = ≥ 3 consecutive lost send attempts):
| arm | startup n / lost | scheduled n / lost | unplanned n / lost | massfail n / lost | other n / lost | lost per scheduled handover | median outage, scheduled (s) | median outage, unplanned (s) |
|---|---|---|---|---|---|---|---|---|
| anthocnet | 1 / 3 | 257 / 2062 | 649 / 4329 | 0 / 0 | 10 / 74 | 9.37 | 2.00 | 1.75 |
| aodv | 2 / 17 | 232 / 12695 | 509 / 7256 | 0 / 0 | 106 / 1223 | 57.70 | 3.25 | 2.25 |
| olsr | 80 / 2789 | 259 / 6009 | 551 / 5685 | 0 / 0 | 55 / 543 | 27.31 | 5.25 | 2.12 |
| geo-greedy | 80 / 41274 | 41 / 13236 | 75 / 998 | 0 / 0 | 0 / 0 | 60.16 | 92.00 | 2.12 |
| oracle | 0 / 0 | 1 / 4 | 252 / 830 | 0 / 0 | 4 / 15 | 0.02 | 1.00 | 0.75 |
| oracle-delay | 0 / 0 | 0 / 0 | 0 / 0 | 0 / 0 | 0 / 0 | 0.00 | — | — |
| arm | hop changes / flow / min | mean hops (delivered) |
|---|---|---|
| anthocnet | 2.07 | 9.29 |
| aodv | 0.76 | 9.05 |
| olsr | 0.83 | 8.65 |
| geo-greedy | 0.84 | 6.33 |
| oracle | 1.02 | 8.72 |
| oracle-delay | 1.08 | 8.76 |
AODV's and OLSR's lower delay99 on walker16 (125 vs 140 ms) is survivorship: they deliver 15.5 and 9.0 pp fewer packets, and the ones they drop are the ones a detour would have made late.
OLSR, the proactive baseline, sits between AODV and AntHocNet. AntHocNet delivers +8.96 pp more (20 of 20 seeds, p = 9.6e-05) at the same mean delay (−0.04 ms, p = 0.94), with a third of OLSR's routing overhead (NRL 97.6 vs 306.6). OLSR loses 27.3 packets per scheduled handover — half of AODV's 57.7, three times AntHocNet's 9.4 — consistent with its topology view lagging each 15 s reconfiguration by its TC interval. It is also the only arm that refuses packets at the source (2.91 %: no route yet), and every one of its 80 flows (4 × 20 seeds) opens with a startup outage while the first topology floods converge.
starlink1
| arm | seeds | PDR % | mean delay (ms) | delay99 (ms, boot) | NRL | refused at source % |
|---|---|---|---|---|---|---|
| anthocnet | 20 | 79.43 ± 0.41 | 84.61 ± 1.18 | 210.2 [205.1, 215.7] | 955.45 ± 17.11 | 0.00 |
| aodv | 20 | 51.23 ± 1.18 | 108.48 ± 5.40 | 1644.1 [1461.1, 1785.0] | 904.16 ± 24.48 | 0.00 |
| geo-greedy | 20 | 3.81 ± 0.01 | 25.29 ± 0.45 | 27.9 [27.0, 28.9] | 0.00 ± 0.00 | 0.00 |
| oracle (bound) | 20 | 95.27 ± 0.34 | 78.66 ± 0.11 | 132.1 [132.0, 132.2] | 0.00 ± 0.00 | 0.00 |
| oracle-delay (bound) | 20 | 94.92 ± 0.22 | 74.89 ± 0.07 | 117.5 [116.7, 118.5] | 0.00 ± 0.00 | 0.00 |
AntHocNet − arm, paired per seed (95 % t-CI, Wilcoxon p):
| vs | n | Δ PDR (pp) | Δ mean delay (ms) |
|---|---|---|---|
| aodv | 20 | +28.20 [+26.90, +29.50], p=1.9e-06 | -23.86 [-28.97, -18.75], p=1.9e-06 |
| geo-greedy | 20 | +75.62 [+75.21, +76.03], p=9.6e-05 | +59.32 [+57.97, +60.68], p=1.9e-06 |
Handover metric family (sums over seeds; outage = ≥ 3 consecutive lost send attempts):
| arm | startup n / lost | scheduled n / lost | unplanned n / lost | massfail n / lost | other n / lost | lost per scheduled handover | median outage, scheduled (s) | median outage, unplanned (s) |
|---|---|---|---|---|---|---|---|---|
| anthocnet | 0 / 0 | 592 / 5958 | 1573 / 11779 | 0 / 0 | 100 / 538 | 9.93 | 2.25 | 1.75 |
| aodv | 6 / 820 | 399 / 20705 | 874 / 16701 | 0 / 0 | 276 / 7453 | 34.51 | 5.12 | 2.25 |
| geo-greedy | 80 / 83762 | 40 / 7353 | 0 / 0 | 0 / 0 | 0 / 0 | 12.26 | 47.00 | — |
| oracle | 2 / 7 | 7 / 27 | 693 / 2354 | 0 / 0 | 17 / 66 | 0.04 | 1.00 | 0.75 |
| oracle-delay | 1 / 4 | 7 / 25 | 782 / 2671 | 0 / 0 | 22 / 77 | 0.04 | 1.00 | 0.75 |
| arm | hop changes / flow / min | mean hops (delivered) |
|---|---|---|
| anthocnet | 8.71 | 25.60 |
| aodv | 1.86 | 20.70 |
| geo-greedy | 1.37 | 4.14 |
| oracle | 2.82 | 23.75 |
| oracle-delay | 2.83 | 24.23 |
On S1, AntHocNet's control overhead (NRL 955) is in the same range as AODV's (904), on a 1584-node shell — the cost question #207 asked. It pays for that with 4.7× the hop-change rate of AODV: ants keep moving traffic to the currently-shortest path, which is what the delay result shows. The oracle arms' "unplanned" outages are the 1 s re-solve interval on S1 meeting the 1 % ISL failure overlay — a cost of the bound's sampling, not of routing.
starlink1-storm
| arm | seeds | PDR % | mean delay (ms) | delay99 (ms, boot) | NRL | refused at source % |
|---|---|---|---|---|---|---|
| anthocnet | 20 | 78.79 ± 1.04 | 90.04 ± 1.95 | 212.8 [208.1, 217.4] | 957.42 ± 63.39 | 0.00 |
| aodv | 20 | 46.49 ± 2.39 | 111.82 ± 5.71 | 1704.0 [1546.8, 1841.3] | 1018.31 ± 63.81 | 0.00 |
| geo-greedy | 20 | 3.60 ± 0.48 | 25.48 ± 0.63 | 27.4 [26.6, 28.4] | 0.00 ± 0.00 | 0.00 |
| oracle (bound) | 20 | 95.08 ± 0.29 | 81.75 ± 1.34 | 134.2 [133.2, 135.7] | 0.00 ± 0.00 | 0.10 |
| oracle-delay (bound) | 20 | 94.95 ± 0.26 | 78.51 ± 1.29 | 126.8 [125.3, 128.4] | 0.00 ± 0.00 | 0.10 |
AntHocNet − arm, paired per seed (95 % t-CI, Wilcoxon p):
| vs | n | Δ PDR (pp) | Δ mean delay (ms) |
|---|---|---|---|
| aodv | 20 | +32.30 [+30.03, +34.57], p=1.9e-06 | -21.78 [-27.29, -16.27], p=1.9e-06 |
| geo-greedy | 20 | +75.19 [+73.94, +76.44], p=1.9e-06 | +64.56 [+62.35, +66.77], p=1.9e-06 |
Handover metric family (sums over seeds; outage = ≥ 3 consecutive lost send attempts):
| arm | startup n / lost | scheduled n / lost | unplanned n / lost | massfail n / lost | other n / lost | lost per scheduled handover | median outage, scheduled (s) | median outage, unplanned (s) |
|---|---|---|---|---|---|---|---|---|
| anthocnet | 0 / 0 | 612 / 6610 | 1528 / 11347 | 42 / 354 | 85 / 510 | 11.15 | 2.25 | 1.75 |
| aodv | 6 / 410 | 378 / 21513 | 716 / 14792 | 18 / 5404 | 297 / 8116 | 36.28 | 5.62 | 2.50 |
| geo-greedy | 80 / 84112 | 38 / 7184 | 2 / 14 | 0 / 0 | 0 / 0 | 12.11 | 47.00 | 1.75 |
| oracle | 3 / 10 | 28 / 124 | 714 / 2428 | 0 / 0 | 11 / 42 | 0.21 | 1.00 | 0.75 |
| oracle-delay | 1 / 4 | 23 / 99 | 776 / 2613 | 0 / 0 | 19 / 68 | 0.17 | 1.00 | 0.75 |
| arm | hop changes / flow / min | mean hops (delivered) |
|---|---|---|
| anthocnet | 9.22 | 26.64 |
| aodv | 1.79 | 20.37 |
| geo-greedy | 0.94 | 5.16 |
| oracle | 3.39 | 24.47 |
| oracle-delay | 3.59 | 24.81 |
The mass failure costs AntHocNet 0.6 pp of PDR and costs AODV 4.7 pp. The outage table says why: AntHocNet's 42 mass-failure outages lost 354 packets in total (≈ 8 each, a few seconds of traffic); AODV's 18 lost 5404 (≈ 300 each — the flow stays black until a route error finally reaches the source and a fresh discovery succeeds).
Calibration
The model is circular orbits on a spherical Earth with propagation-only links (ADR-0022), so calibration asks one thing: are the delays and the reconfiguration timing the right size? Two external references answer it.
Against Hypatia: Paris–Luanda RTT on Starlink S1
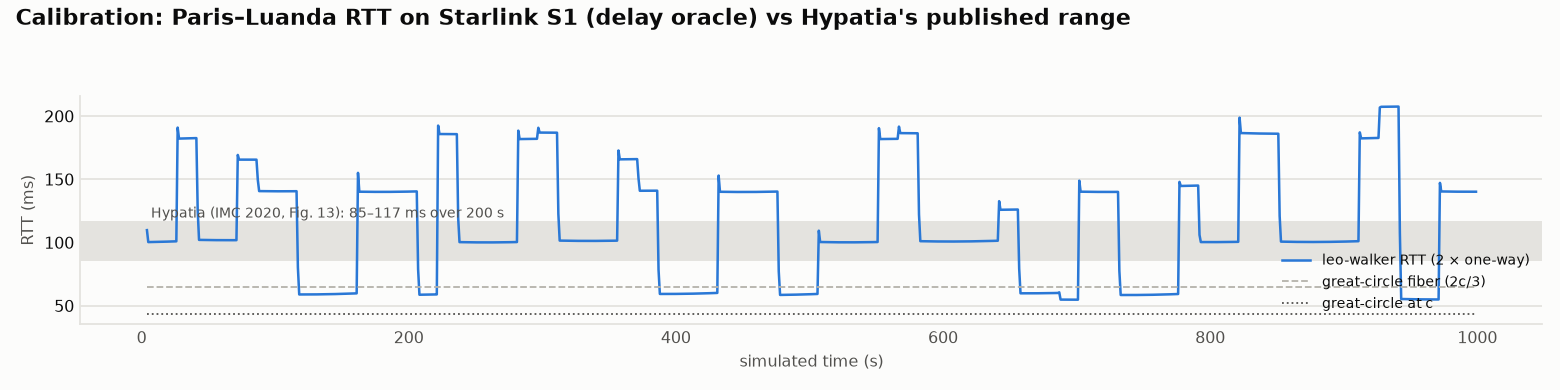
Hypatia (Kassing et al., IMC 2020, Fig. 13) publishes the Paris–Luanda RTT
over 200 s on Starlink S1 (72 × 22, 550 km, 53°, minimum elevation 25°, path
re-solved every 100 ms): 85–117 ms. The hypatia cell reproduces that
setup — --pairs=hypatia, the delay oracle re-solved every 0.1 s, 1000 s,
one flow.
| min | p25 | p50 | p75 | p95 | max | |
|---|---|---|---|---|---|---|
| leo-walker RTT (ms) | 54.8 | 77.2 | 101.0 | 140.3 | 186.4 | 207.5 |
- The median sits inside Hypatia's band (101.0 ms), and 33.5 % of the seconds fall inside 85–117 ms. Mean path length is 20.8 hops.
- The spread is wider than Hypatia's, and the cause is known: leo-walker gives each ground station one serving satellite (the highest one) and hands over on the 15 s clock; Hypatia lets the station use any visible satellite and picks whichever minimises the end-to-end path. The plateaus in the chart are exactly the 15 s-to-minutes stretches where the serving satellite on one end is a poor entry point into the grid (high plateaus) or an unusually good one (low plateaus, under Hypatia's floor). The minimum (54.8 ms) stays above the 43.4 ms great-circle-at-c line; nothing is faster than physics.
- What this means for the routing results: the single-serving-satellite GSL makes every arm's paths longer than an any-visible-satellite model would, by the same geometry for every arm. It moves absolute delays; it does not favour an arm.
Against LENS: one day of a real Starlink dish
LENS (Zhao & Pan, MMSys 2024; dataset CC BY-SA 4.0) publishes raw 10 ms ping
traces from Starlink dishes to their point of presence. One full day of the
bruhl dish (Brühl → Frankfurt PoP, 2026-10-06, 24 hourly traces, 5.96 M
pings) summarised by ns3/tools/lens-calibration.py; derived numbers only,
in docs/benchmarks/cells/lens-bruhl-20261006.txt:
| min | p5 | p50 | p95 | p99 | loss | |
|---|---|---|---|---|---|---|
LENS bruhl RTT (ms) |
11.4 | 16.0 | 20.8 | 33.6 | 47.2 | 0.186 % |
- Delay: a dish-to-PoP RTT is one bent-pipe hop (dish → satellite → gateway, and back). At 550 km and 25° minimum elevation the propagation-only floor for that is 7.3–15.0 ms; LENS's 11.4 ms minimum and 20.8 ms median are that floor plus scheduling and queueing that leo-walker does not model. The model's propagation is the right size; its RTTs are lower bounds.
- Timing — the 15 s clock is confirmed in the wild: binning loss by UTC
second mod 15, LENS loss peaks at phases 11 and 12 (0.399 % and 0.230 %
against a ~0.16 % baseline on every other phase), and median RTT steps up
at phase 12 (21.2 ms against 20.6–20.9). leo-walker's handover clock fires
at phase 12 (
clock=15 clockOffset=12). The scheduled-handover class in the tables above is placed where the real network puts it.
The geo-greedy verdict
Greedy geographic forwarding — the family behind most "position-based LEO routing" proposals — is given every advantage here: perfect global positions, zero control traffic, a forced uplink at the ground station, and the destination's serving satellite (not the city) as the target. It still delivers 41 % on walker16 and under 4 % on Starlink S1.
The failure is structural, not tuning. On a Walker +grid, a satellite's four neighbours sit fore/aft in its own plane and left/right in the adjacent planes. Reaching a destination across planes needs, at some point, a hop that does not reduce Euclidean distance to the target — the grid is a lattice wrapped on a sphere, and the greedy-progress invariant has local minima everywhere planes cross. The 80 "startup" outages per cell are every flow on every seed (4 × 20) beginning inside a local minimum — stuck for a median ~200 s on walker16 and for essentially the whole 300 s run on S1, until satellite motion happens to carry the flow's entry point out of it. Face/perimeter routing, the planar-graph repair that makes greedy forwarding complete in 2-D, has no 3-D equivalent with the same guarantee. geo-greedy's low delay on S1 (25 ms) is survivorship: the only flows it delivers are the short ones.
The cross-plane pairing bug and the superseded runs
The first leo-walker paired each satellite with the same slot in the
neighbouring plane. With Walker phasing, the same slot in the next plane is
not the nearest satellite there: on S1, same-slot cross links averaged
1470.7 km against 636.9 km for the best constant shift, and the Hypatia
calibration came out near 274 ms — almost 3× the published range. An
independent Python model of the shell reproduced the 3×, and the fix
(0b5a65ad) picks one constant slot shift for the whole shell — the one
that minimises the mean cross-link length at t = 0 — with the seam plane
pairing to its nearest satellite.
Each cell's # anchor isl line records the choice, and the CI smoke
(ns3/tools/check-leo-walker.sh) asserts it is no longer on average than
same-slot pairing and shorter than the in-plane chord:
| shell | chosen shift (slots) | cross mean | same-slot mean | in-plane chord |
|---|---|---|---|---|
| walker16 | 15 (≡ −1) | 1838.4 km | 2527.3 km | 2934.5 km |
| starlink1 | 21 (≡ −1) | 636.9 km | 1470.7 km | 1969.9 km |
Every leo-walker cell measured before 0b5a65ad was re-run and is
superseded; none was published. The longer cross links had made every arm's
paths longer by the same geometry, so the arm ranking did not change — but
the absolute delays and the calibration did, and only the re-run numbers are
on this page.
Threats to validity
- Circular orbits, spherical Earth. The stock ns-3.48 model; no J2, no eccentricity, no TLEs. Results are about routing over Walker geometry and delay, not orbital precision (ADR-0022).
- Propagation-only links. ISL and GSL delays are distance / c; no PHY, no weather, no queueing at the gateway. RTTs are lower bounds (the LENS comparison above).
- Single serving satellite per station. The main cause of the wider Hypatia spread; it lengthens every arm's paths alike.
- The oracle bounds are sampled, not continuous. The hop oracle re-solves every 1 s everywhere; the delay oracle every 0.1 s on walker16 and every 1 s on S1, to keep the 20-seed CI run bounded. Their "unplanned" outages are that sampling meeting the ISL failure overlay.
- AODV is order-dependent in ns-3 (#362): stock AODV keys socket maps on heap addresses. Each arm runs alone in its own dispatch here, so no arm's numbers depend on another's.
- 10 Mbps links, 2 kbit/s flows. The load is light on purpose — this is a reachability-under-motion test, not a capacity one. Congestion on ISLs is #206's question.
- No OLSR on S1. Proactive link-state flooding on 1584 nodes exceeds the CI budget; it is measured on walker16 only, where 20 seeds already took 5 h 54 min.
Reproduce
# one arm of one cell, locally in the 3.48 image (S1, 20 seeds)
./ns3 run "leo-walker --csv --protocols=anthocnet --planes=72 --sats=22 --phasing=39 \
  --altitude=550 --inclination=53 --minElevation=25 --time=300 --runs=20 \
  --islDown=0.01 --oracleInterval=1"

# the tables on this page, from the committed cells
python3 ns3/tools/leo-summary.py walker16 starlink1 starlink1-storm

# the charts
python3 ns3/tools/family-charts.py
In CI: satellite-benchmark.yml, harness=leo-walker, one arm per dispatch,
with the cell's flags in extraArgs.